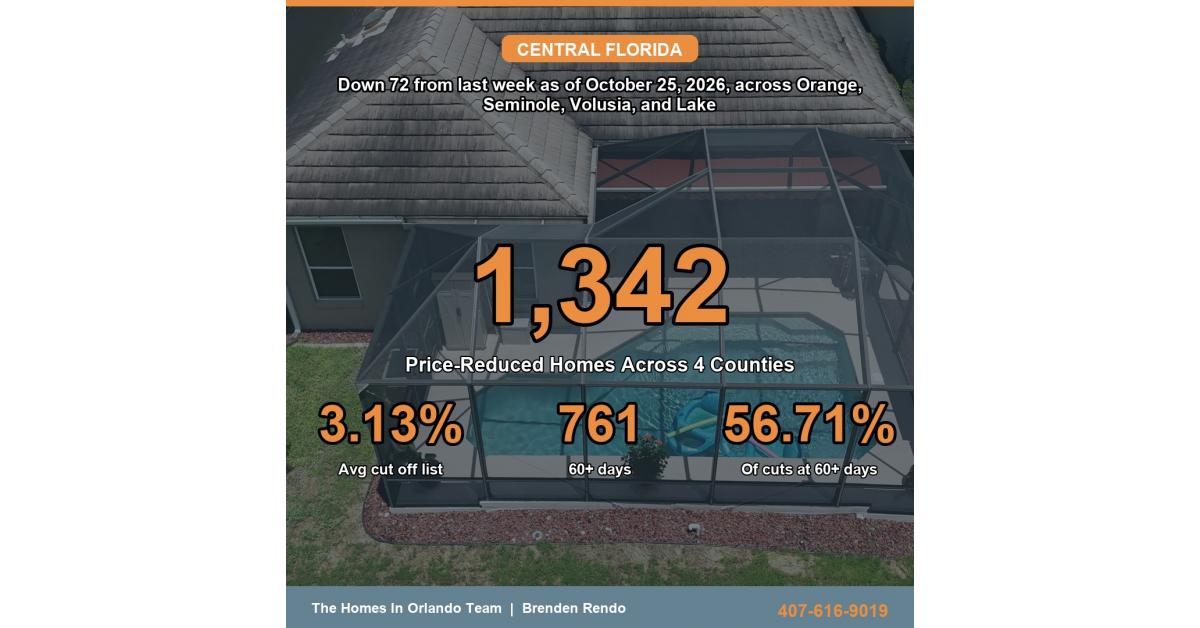
When more than half of all price-reduced homes in a region have already been sitting on the market for two months or longer, it signals a market that is anything but uniform. A fresh weekly analysis of Stellar MLS data across four Central Florida counties reveals 1,342 active residential listings took a price cut in the seven days ending October 25, 2026 — and 761 of those, or 56.71%, have been listed for 60 days or more.
Brenden Rendo, Realtor

Visit HomesInOrlando.ForSale

NextHome Neighborhood Realty
Across Orange, Seminole, Volusia, and Lake counties, 761 reduced listings have sat 60 or more days, with an average cut of 3.13% off the prior asking price.

ORLANDO, FL, UNITED STATES, October 25, 2026 /EINPresswire.com/ — The data, compiled by The Homes In Orlando Team, covers Orange, Seminole, Volusia, and Lake counties. The average price reduction across all 1,342 listings was 3.13% off the previous asking price. Notably, this represents 72 fewer reductions than the prior seven-day window, a 5.09% decline in weekly count.
The complete report, including county-level tables, methodology, and citation references, is published and updated weekly at https://www.homesinorlando.forsale/central-florida-housing-market/#weekly-price-reductions.
Of the 1,342 total reductions, 761 listings — or 56.71% — have been on the market for 60 days or longer. That figure is the one that Rendo says sellers and buyers alike should focus on most closely.
“The number that matters more than the size of the cut is the calendar,” said Brenden Rendo, Realtor with The Homes In Orlando Team at NextHome Neighborhood Realty. “A seller who has already reduced once and is still waiting has demonstrated both motivation and a willingness to move on terms, which is a different negotiating position from a listing that came to market last week at a confident price.”
Looking county by county, Orange County led the region with 633 reduced listings. Volusia County posted the deepest average reduction at 3.67% off list price, while Lake County recorded the highest share of listings lingering at 60 days or more — a striking 63.21%. That share ranged from a low of 52.02% in Seminole County to that 63.21% peak in Lake County, an 11.19-point spread that, as Rendo’s analysis notes, suggests four distinct local market conditions rather than a single regional trend. Buyers comparing one county to another, the report warns, are not comparing like for like.
Four-County Price Reduction Snapshot (October 25, 2026)
County Reduced Listings Change vs Prior Week Average Reduction 60+ Days Share 60+ Days Average List Price
Orange 633 up 33 3.07% 353 55.77% $548,435
Seminole 198 down 17 2.77% 103 52.02% $462,368
Volusia 231 down 36 3.67% 128 55.41% $428,911
Lake 280 down 52 3.06% 177 63.21% $450,695
Central Florida 1,342 down 72 3.13% 761 56.71% $494,770
Methodology
Figures cover active residential listings only, pulled from Stellar MLS and filtered to property type Residential, which excludes land, commercial, and lease listings. A listing counts as reduced when its most recent price change, made within the 7-day window ending on the pull date, lowered its list price; the reduction is measured against the list price just before that change. A listing reduced twice in the window counts once, and one reduced then raised does not count. Listings whose sellers opted out of internet display are excluded, as are records with a zero, unreadable, or above 50% reduction, which are treated as entry errors. Days on market is the larger of the MLS cumulative days on market and the days since the current listing went on market, so a listing withdrawn and relisted keeps its earlier history; the 60 day figures count listings at 60 days or more. The change column compares this seven-day window with the separate window before it. Osceola County is outside the coverage area and is excluded. Counts are refreshed weekly and reflect October 25, 2026.
About The Homes In Orlando Team
The Homes In Orlando Team at NextHome Neighborhood Realty covers Orange, Seminole, Lake, and Volusia counties in Central Florida, and publishes weekly market data drawn directly from Stellar MLS. Brenden Rendo can be reached at 407-616-9019.
Members of the press are welcome to use these figures with attribution. For county or city level breakdowns not shown here, contact Brenden Rendo directly.
Brenden Rendo
The Homes In Orlando Team
+1 407-616-9019
Visit us on social media:
LinkedIn
Instagram
Facebook
YouTube
TikTok
Why it matters: With more than half of reduced listings lingering past 60 days and an 11-point gap in stale-inventory share between counties, Central Florida’s housing market is not one story but several. Buyers and sellers who treat the region as a single market risk misjudging negotiating leverage — and the data suggests that patience may be rewarded differently depending on which county line you cross.