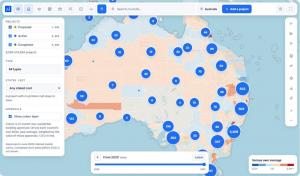
As of October 5, 2026, the HtAG Projects infrastructure map displays distinct project pins alongside council-level building-approval color coding.
Buyer’s agents and investors can leverage HtAG Projects to identify named developments, examine publicly available evidence, and incorporate sourced information into client reports or further due diligence work.

HtAG Projects enables buyer’s agents and investors to confirm more than 8,000 Australian infrastructure projects, complete with identified sources, current stages, and reports ready for client use.
When buyer’s agents and investors hear promises about a new hospital or railway line, HtAG Projects allows them to verify that claim against a specific project, its current phase, and its source—at no cost.”— Dr Matija Djolic, HtAG AnalyticsSYDNEY, NEW SOUTH WALES, AUSTRALIA, October 5, 2026 /EINPresswire.com/ — Property listings and marketing materials frequently make infrastructure claims that are challenging to confirm. A so-called “new hospital” might exist only as a proposal, a rail link could be announced yet unfunded, and the relevant documentation is typically scattered across various agency programs, registers, council applications, and project webpages. Buyer’s agents require verifiable sources to cite in client notes. Investors need clarity on what to question before accepting a promise as fact.
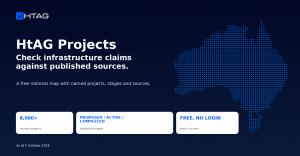
HtAG Analytics has introduced HtAG Projects to address this issue: a complimentary national research map featuring over 8,000 identified public and private infrastructure projects throughout Australia, current as of October 5, 2026.
Essentially, HtAG Projects transitions a buyer’s agent or investor from a promotional assertion to a named development with a disclosed phase, stated budget, timeline, and origin, ready for verification or client reporting—without suggesting infrastructure automatically guarantees property value increases.
What exactly is HtAG Projects?
HtAG Projects is a free, login-free mapping tool designed to reduce the time between hearing an infrastructure claim and verifying the published evidence behind it. Users can search by project name, location, or council area, view individual projects, or access a written summary for an entire council.
As of October 5, 2026, the map’s live counter indicates 8,594 identified projects: 1,239 are proposed, 3,663 are active, and 3,692 are completed. Published cost figures range from local improvements to multi-billion-dollar initiatives. Work finished prior to 2020 is not included.
New users can follow the step-by-step research guide, which walks through taking a project from the map to source verification and a one-page summary.
Why infrastructure claims are difficult to verify
The challenge is rarely a shortage of information; it is dispersed sources and ambiguous terminology. “Coming soon” could refer to a project that has merely been announced. HtAG Projects employs three distinct published stages to maintain clarity: proposed means announced or in planning; active means approved, awarded, or under construction; completed means delivered. These categories help prevent an announcement from being misrepresented as active construction. Users should still examine the named source, as dates, costs, and statuses may shift.
How buyer’s agents can utilize it
A buyer’s agent can employ HtAG Projects before making or defending a client recommendation:
• Search the suburb, area, or council and distinguish between proposed, active, and completed work.
• Open relevant projects and review the name, published phase, timeline, stated cost, and source.
• Copy a source-ready citation into the client report so the evidence can be verified.
• Export the council view as an A4 brief, CSV, or PNG, or copy the written summary as text.
The benefit is quicker verification and a more transparent evidence trail. A recommendation can differentiate a plan from work in progress and show the client exactly where the evidence originated.
How investors can use it
An investor can use the map to challenge a claim made in a listing, a conversation, or a suburb overview. If someone asserts that a rail link, hospital, or industrial project is “coming,” the next questions are whether it is announced, approved, awarded, or under construction, who is delivering it, and which source supports the description.
The map does not indicate that a project will lead to price or rent increases or any specific investment result. It provides the investor with a sourced starting point for independent checks and for professional advice when necessary.
A practical example: Western Downs
The public Western Downs summary at https://www.htag.com.au/projects/qld/western-downs/ displays 42 identified projects as of October 5, 2026: 7 proposed, 10 active, and 25 completed. It shows $44.1 billion in stated costs across the 30 projects with a published value.
The summary also lists active energy, transport, community, and water work, along with proposed energy and industrial projects. Each project can be opened individually, so a statement made to a client relies on named records and sources rather than just the council total.
What the council colors indicate
A pin represents one named capital project. A council color compares the most recent 12 months of non-residential building approvals against that council’s own three-year average, weighted by the value of those approvals.
A reading of 1.0 matches the council’s own recent activity; below 1.0 indicates quieter activity, and above 1.0 indicates busier activity. The comparison is against the council’s own history, not neighboring areas, and it is not a property-price forecast. Price, rent, and yield data for the same councils is available separately at https://www.htag.com.au/lga-suburb-heatmap/.
Where the project data originates
HtAG Projects compiles named works from the bodies that construct them and the registers that record them, including transport, school, and health agencies, energy and water utilities, national and state infrastructure pipelines, Defence, major-project lists, and council development applications. Stated values are the costs published for each project, not HtAG estimates.
The map is in beta and coverage varies between councils, so it functions as a starting point rather than a comprehensive register. Every council’s public summary is listed at https://www.htag.com.au/projects/.
How to access HtAG data in AI tools
Developers and teams building research workflows can access HtAG data through the Developer Portal at https://developer.htagai.com/, which offers API and MCP access for approved applications and AI tools.
About HtAG Analytics
HtAG Analytics is an Australian property intelligence company. Its research platform covers 7,000+ suburbs with 150+ metrics, and its data is available to AI agents through 70+ public MCP tools across 6 MCP servers. HtAG builds tools that help property professionals and investors examine evidence and differentiate published observations from unsupported claims.
Source note
Figures describing HtAG Projects are observations from the live product page and the Western Downs public summary as of October 5, 2026. Project stages, costs, and timing can change; check the source attached to each project before relying on it. HtAG Projects provides research information, not personal financial, credit, legal, or property-investment advice.
Dr Matija Djolic
HtAG Marketing
admin@htag.com.au
+61 2 5563 4415
Visit us on social media:
LinkedIn
Instagram
Facebook
YouTube
TikTok
X